Published: Apr 6, 2020 by Shin Young Kim
I was tasked to attempt to add weather data(precipitation, temperature) to enhance forecast results for meal consumption quantity in a military mess hall near Daejon, Korea.
The Data I recieved was daily meal consumption quantity from January 1st, 2019 to August 30th of the same year. Additionaly, some dates were missing from the data, which is believed to be from days which the mess didn’t open, like holidays or leaves.
The plot below shows the consumption quantity plotted against dates, with selected peaks and floors marked as red and blue dots:
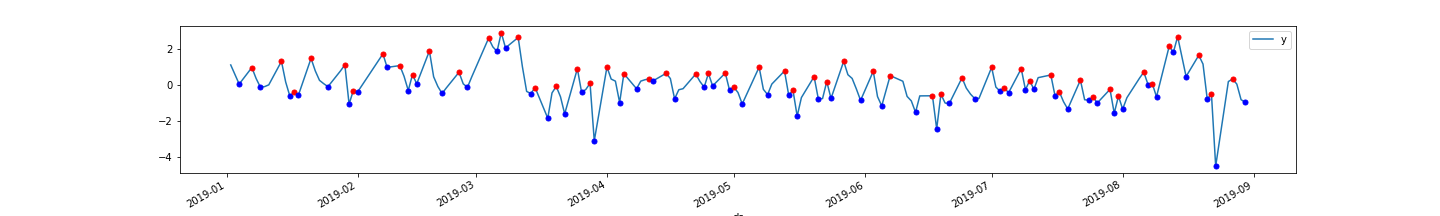
Upon first look, some sort of seasonality can be seen, although not exact, since we have to remember that some dates are missing, meaning time axis is not uniform.
I tried plotting some autocorrelation plots of various lags to try to grasp seasonality intervals:
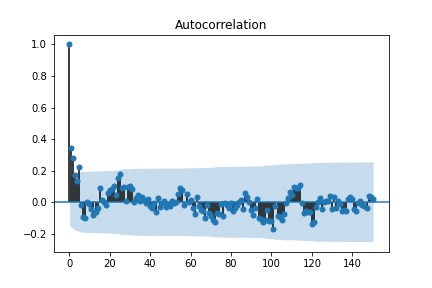
As you can see, using just an ACF plot it’s hard to figure out the seasonality intervals.
For the sake of analysis, decided to use seasonality values of 5, 7, 15, and 31.
My goal was to see if adding standarized precipitation and average temperature data would make meaningful impact to prediction accuracy.
As a result, regression without weather data added as a feature resulted in a RMSE of 1.18(in standarized scale).
Unfortunately, adding weather barely improved the result, pushing it up to a measly 1.14.
Adding raw weather data was not effective in this specific datset. Additional preprocessing would be required to effectively incorporate the data. I’m currently thinking of applying a Logistical function to precipitation, because one of my hypothesis is that less people are likely to be active the more raint it falls.